The New Russell Wilson?

canfan

Member
Joined
Sep 10, 2012
Messages
454
Reaction score
0
Jville":3r01f35f said:
RWavgtimetothrow
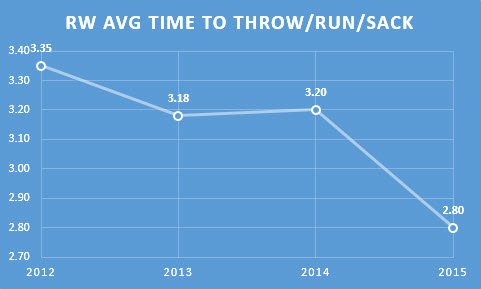
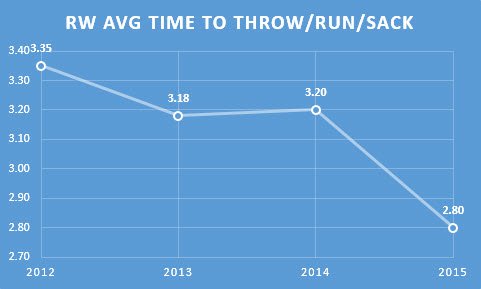
The above chart shows the average time it has taken Wilson to either throw, scramble past the line of scrimmage or get sacked. I have hammered him on this number for his first three years. The best quarterbacks in the NFL, the experienced quarterbacks in the NFL, are at the opposite end of this stat than Wilson has been. He literally has been the worst in football at putting his line in a tough position to block for the longest time and the worst at getting rid of the ball on time within the framework of the offense.

He has made significant strides here, and is now in the middle of the pack through two games.

Link to more analysis in a most interesting article >>> [urltargetblank]http://www.hawkblogger.com/2015/09/the-new-russell-wilson.html?utm_source=feedburner&utm_medium=twitter&utm_campaign=Feed%3A+HawkBlogger+%28Hawk+Blogger%29[/urltargetblank]

I believe our Oline performance vs the Rams really assisted him in getting that number down. A larger sample size will be needed to find out if this trend is voluntary!
 

Chukarhawk

Well-known member
Joined
Sep 23, 2011
Messages
4,090
Reaction score
1,510
All I know is that Russell has not looked good so far this season. Not good at all. he needs to step up his game in a big way.
 

mrblitz

Well-known member
Joined
May 6, 2009
Messages
1,669
Reaction score
40
kearly":1xrz18cq said:
The Matrix outfit for Wilson, I wonder if that shot was taken just after a music video shoot or something.

maybe he was just getting back from the 'entourage' shoots.
 

Recon_Hawk

Well-known member
Joined
Jul 18, 2010
Messages
3,302
Reaction score
455
Location
Vancouver, Wa
Sgt. Largent":mowmnb8y said:
CalboHawk":mowmnb8y said:
The new Russell Wilson has become very lazy at selling play-action and isn't nearly as sharp with his hand-offs. Small sample size, but his TD/INT ratio doesn't look good and his YPA also continues to drop. Not sure what to make of it, but he hasn't looked good since the end of last season.

I blame Ciara.

12019900_1097453800278723_3553656848686850407_n.jpg

Ciara: "Russell. I love you, but you really need to should change how you dress if you want to be taken serious."

RW: "What did you have in mind?"

Ciara: "Well...have you ever seen the movie Blade?"
 

Anthony!

New member
Joined
Nov 19, 2013
Messages
4,050
Reaction score
0
Location
Kent, wa
Chukarhawk":3640tuze said:
All I know is that Russell has not looked good so far this season. Not good at all. he needs to step up his game in a big way.

:pukeface:
 

hawk45

Active member
Joined
Sep 27, 2009
Messages
10,009
Reaction score
16
AgentDib":3ogs2ix0 said:
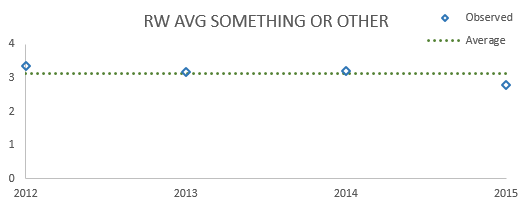
Anytime you see a chart with the Y-axis clipped your inner skepticism should be setting off alarm bells. Here's another way that chart could look.

Jddpv46

Now I probably wouldn't present it that way if I was trying to fit the data into some sort of agenda. People would correctly point out that that tiny dip at the end could easily just be the result of a tiny sample size of two road games including one against the Rams D-Line, and that if this exact same analysis was done after this Sunday the point could be above the line instead (and the entire argument reversed).

If increments of less than a second represent a significant difference in the quantity being measured, and the band of function is from 2 to 5 or whatever, why doesn't it make sense to clip the Y axis and zoom so you can see higher granularity? This is done all the time in engineering and I have to assume any field where graphs are used, in fact depending on what kind of data you're looking at you might never be interested in the distance to the x axis. What am I missing?

The point about the small sample size is totally true, vs. the Rams he either got rid of it in 2 or was obliterated or ran away. But your point about the chart reversing works just as well with the graph zoomed in on that area.
 

chris98251

Well-known member
Joined
Feb 27, 2007
Messages
39,670
Reaction score
1,692
Location
Roy Wa.
The real question is... Is he Black enough yet?

Saying that since it was a topic when he was married to she whom Golden Tate made tap out rumor has it.......
 

kearly

New member
Joined
Mar 6, 2007
Messages
15,975
Reaction score
0
AgentDib":3f4etaqh said:
Anytime you see a chart with the Y-axis clipped your inner skepticism should be setting off alarm bells.

It depends. Sometimes a tiny degree can be a big deal. In those situations, I think the use of a clipped Y-axis makes sense. But generally, I agree that it's to be avoided.
 

AgentDib

Well-known member
Joined
Oct 1, 2010
Messages
5,471
Reaction score
1,240
Location
Bothell
hawk45":2wzkjw95 said:
If increments of less than a second represent a significant difference in the quantity being measured, and the band of function is from 2 to 5 or whatever, why doesn't it make sense to clip the Y axis and zoom so you can see higher granularity? This is done all the time in engineering and I have to assume any field where graphs are used, in fact depending on what kind of data you're looking at you might never be interested in the distance to the x axis.
And it's widely used incorrectly (sometimes deceptively) there as well. If the purpose of fitting a line between scatter point plots is to illustrate a trend, then monkeying with the Y-axis is right off of page 2 of the 'how to lie with statistics' manual. Ask yourself why the line itself exists and not just the points, and what the line is trying to convey. If you're drumming up or allaying concerns than there are better and more rigorous ways of doing so along with explicitly stating the significance level of your trend. But yes, what I am specifically objecting to here is the use of this method as a persuasion tactic.

kearly":2wzkjw95 said:
Sometimes a tiny degree can be a big deal.
For sure, and there are lots of methods available to emphasize that. Cutting off the chart in order to make a small percentage change appear enormous is a poor option, particularly when your target audience is the the general public. The honest approach here is to show that the actual change is a small percentage and then to make the case that it still matters (although it doesn't here), rather than trying to slip it past the readers.
 

hawk45

Active member
Joined
Sep 27, 2009
Messages
10,009
Reaction score
16
Dib, in engineering I suppose it can be used deceptively but in textbooks, and I'm thinking of generator characteristics here but it applies also so smaller signals, narrowing the focus is critical. In the same way, sometimes you widen the focus with logarithmic scales, because you need to see deviations at both higher and lower ranges and don't care as much about the smaller scale. I'm talking about graphs passed between engineers to determine optimal operating ranges where the only concern is arriving at optimum, where agenda is completely out of it, of course. These graphs have no agenda, because they're used to lessen fuel consumption, reduce wear and tear, etc.

Guess what I'm saying is, and it's what Kearly said, it's all about the quantity you're measuring. How many seconds it takes a QB to release the ball, small deviations (if they're consistent) matter, and so the higher granularity is called for. In a statistical sense, yes, manipulations can be used to make a point, but in this case it doesn't seem that way because the granularity is appropriate. BUT, the sample size needs to be large enough to establish a trend. The sample size is what I take issue with here, not the scale or placement of the axes.

Again agreeing that representing the entire 2015 with a single point after two games is misleading, and really fairly useless as a basis for a discussion as to whether a QB has changed materially or not. Especially because the time to QB for the Ram defense, which represents half of your sample, is hopelessly skewed towards the lower end.
 

Hawks46

New member
Joined
Apr 30, 2009
Messages
7,498
Reaction score
0
It's only been two games, so it's tough to say for certain, but I'd say most of this is due to the OL.

He's had to throw it more quickly, or he'd have been sacked 15 times already.

Also, what scews this stat is the last part, which includes sacks.

So the time Wilson takes to get rid of the ball is factored in with sacks. Behind this OL ? Yeesh. That will make a difference.
 

SalishHawkFan

New member
Joined
Apr 30, 2009
Messages
5,872
Reaction score
0
2014 regular season: 20 TD, 7 INT.
2014 playoffs and first two games of 2015 regular season (last 5 games): 9 TD, 7 INT.

My first thought is 20 TD's for the season was really crap. That's not special. My second thought is, if he keeps this pace up, he'll finish this season with 24TD, 16 INT. That's significantly worse.

I expect as the season unwinds and we face a few more patsies like the Bears, he'll have better games and his TD pace should increase, while his INT pace should decrease.
 

Thepeelsessions

New member
Joined
Oct 4, 2009
Messages
1,848
Reaction score
0
Location
Out here
Sgt. Largent":35ad5j1c said:
CalboHawk":35ad5j1c said:
The new Russell Wilson has become very lazy at selling play-action and isn't nearly as sharp with his hand-offs. Small sample size, but his TD/INT ratio doesn't look good and his YPA also continues to drop. Not sure what to make of it, but he hasn't looked good since the end of last season.

I blame Ciara.

12019900_1097453800278723_3553656848686850407_n.jpg

Man, Russ looks like such a tool in both those outfits. HOWEVER, the Tommy B. Pic might be a little better. I've always wanted a Hawaiian button up, but I can never find them in my size. A medium always fits like a triple XL. It's the darnedest thing.
 

Bobblehead

Well-known member
Joined
Dec 10, 2012
Messages
4,229
Reaction score
838
canfan":26c09vrr said:
Jville":26c09vrr said:
RWavgtimetothrow
The above chart shows the average time it has taken Wilson to either throw, scramble past the line of scrimmage or get sacked. I have hammered him on this number for his first three years. The best quarterbacks in the NFL, the experienced quarterbacks in the NFL, are at the opposite end of this stat than Wilson has been. He literally has been the worst in football at putting his line in a tough position to block for the longest time and the worst at getting rid of the ball on time within the framework of the offense.

He has made significant strides here, and is now in the middle of the pack through two games.

Link to more analysis in a most interesting article >>> [urltargetblank]http://www.hawkblogger.com/2015/09/the-new-russell-wilson.html?utm_source=feedburner&utm_medium=twitter&utm_campaign=Feed%3A+HawkBlogger+%28Hawk+Blogger%29[/urltargetblank]

I believe our Oline performance vs the Rams really assisted him in getting that number down. A larger sample size will be needed to find out if this trend is voluntary!
Actually I think that chart is the average time the Line give Wilson to throw.
 

MizzouHawkGal

Well-known member
Joined
Aug 16, 2012
Messages
13,477
Reaction score
846
Location
Kansas City, MO
SalishHawkFan":3qjh69s1 said:
2014 regular season: 20 TD, 7 INT.
2014 playoffs and first two games of 2015 regular season (last 5 games): 9 TD, 7 INT.

My first thought is 20 TD's for the season was really crap. That's not special. My second thought is, if he keeps this pace up, he'll finish this season with 24TD, 16 INT. That's significantly worse.

I expect as the season unwinds and we face a few more patsies like the Bears, he'll have better games and his TD pace should increase, while his INT pace should decrease.
Wow, bet that was hard to figure out. Overall this thread is ridiculous and when Anthony is totally correct that should make some on this thread think about taking a hard look at their stance concerning Wilson.

Just a suggestion.
 

DavidSeven

New member
Joined
Jan 18, 2013
Messages
5,742
Reaction score
0
Extrapolating from this data to support a positive trend doesn't seem particularly useful. We spent an entire game against the Rams throwing designed quick-passes based on their matchup advantages and their soft coverage outside. The tradeoff between improved time-to-throw and declining YPA isn't something to be too excited about IMO. You'd prefer to see the timing improve with the YPA remaining somewhat consistent. But again, the Rams matchup skews this data in both positive and negative ways.

And even with that outlier game, his time-to-throw numbers still appear to trail elite QBs by some significant margin. That's sort of alarming, though Russell does make better things happen at the 3rd second than most any other QB, so there's some leeway you're willing to give him there. Nevertheless, it'd be cool to see the numbers inch faster over time.
 

Popeyejones

Active member
Joined
Aug 20, 2013
Messages
5,525
Reaction score
0
kearly":zhd66l46 said:
AgentDib":zhd66l46 said:
Anytime you see a chart with the Y-axis clipped your inner skepticism should be setting off alarm bells.

It depends. Sometimes a tiny degree can be a big deal. In those situations, I think the use of a clipped Y-axis makes sense. But generally, I agree that it's to be avoided.

Yep.

For something like starting QB completion % across a year a 0-100 range on the Y doesn't make any sense; 80% or so of your Y is just going to be blank space (nobody is below 50 or above 70). For something like that I think it's fair to scale the Y to something like 20% below the Min and Max for the pop.

Some of these are unintentionally a bit deceptive tho (although the big one -- two games in '15 -- is acknowledged).
 

chrispy

Well-known member
Joined
Apr 21, 2011
Messages
1,082
Reaction score
1,121
I'd like to see 4 data-set overlayed graph that includes average time behind the line, relative hotness of significant other, wins, and relative acceptability of wardrobe.
 
Top